


LOKET
LOKET
Effortless Occassions — Enhancing the Way You Organize Event
Effortless Occassions — Enhancing the Way You Organize Event
[case.study]
[ui—ux.design]
[web.app]
[event.dashboard]
[desktop]
[2023]

LOKET
Effortless Occassions — Enhancing the Way You Organize Event
[case.study]
[ui—ux.design]
[web.app]
[event.dashboard]
[desktop]
[2023]
[approach]
Secondary Research
Comparative Research
Usability Testing
[role]
UX Researcher
UI/UX Designer
[timeframe]
2 Weeks
[tools]

[approach]
Secondary Research
Comparative Research
Usability Testing
[role]
UX Researcher
UI/UX Designer
[timeframe]
2 Weeks
[tools]
[overview]
[overview]
With various concerts making a comeback post-COVID, many organizers opt to use event management softwares nowadays to manage their events. Evidently, it has become increasingly popular in recent years, as it enhances efficiency, communication, and the overall experience of planning and participating in events.
Unfortunately, the current process of managing an event is manual and lacks real time data insights, which could lead to missed opportunities and lost revenue if let alone. Hence, it is crucial to use and utilize the best event management software.
LOKET was designed to address these challenges by providing an intuitive, data-driven, and visually engaging dashboard that empowers organizers to manage events more effectively and confidently.
DESIGN PROCESS
DESIGN PROCESS


01.
01.
Understanding Design Brief and Scope
Understanding Design Brief and Scope
[design.requirements]
Dashboard
Audience Management
Check-in Management
Booth Sales Management
Real-time Update
User Management
[design.consideration]
User Experience
Data Visualization
Real-time updates
Security
Scability
[target.user]
Event Managers
Staff Events
[design.requirements]
Dashboard
Audience Management
Check-in Management
Booth Sales Management
Real-time Update
User Management
[design.consideration]
User Experience
Data Visualization
Real-time updates
Security
Scability
[target.user]
Event Managers
Staff Events
[design.requirements]
Dashboard
Audience Management
Check-in Management
Booth Sales Management
Real-time Update
User Management
[design.consideration]
User Experience
Data Visualization
Real-time updates
Security
Scability
[target.user]
Event Managers
Staff Events
02.
02.
Secondary Research and Comparative Analysis
Secondary Research and Comparative Analysis

[my.research]
[my.research]
I'm exploring platforms similar to LOKET on YouTube to find content references and structural hierarchies that could be incorporated into the LOKET dashboard. I've also registered accounts on these platforms to gain a more in-depth understanding of their structure and information organization.
I'm exploring platforms similar to LOKET on YouTube to find content references and structural hierarchies that could be incorporated into the LOKET dashboard. I've also registered accounts on these platforms to gain a more in-depth understanding of their structure and information organization.
COMPARATIVE ANALYSIS
COMPARATIVE ANALYSIS
[01]
GOERS
Goers focuses on user engagement and community-building, making it suitable for a variety of events. It offers an intuitive and engaging event discovery experience with data on user interaction.
[02]
TICKETMASTER
Ticketmaster is a trusted platform for ticket sales, especially for large-scale events. It offers access to a broad spectrum of events, detailed analytics, and features for managing season ticket holders.
[03]
TIX EVENTS
Tix Event is a versatile platform that caters to various event types. It provides a straightforward ticket purchase process and offers data on ticket sales and audience demographics.
[04]
EVENTBRITE
Eventbrite is renowned for its user-friendly event discovery and registration process. It accommodates events of all sizes and encourages community-building. It provides comprehensive event analytics and sales tracking.
[conclusion]
[conclusion]
Base on secondary research, and comparative research findings, LOKET will be design and create a system that is easy to use, visually engaging, and provides real-time data insights to help event managers make informed decisions.
Base on secondary research, and comparative research findings, LOKET will be design and create a system that is easy to use, visually engaging, and provides real-time data insights to help event managers make informed decisions.

03.
03.
Ideation, Creating Design, and Prototyping
Ideation, Creating Design, and Prototyping
[design.style]
[design.style]
Design style in UI/UX refers to the visual presentation and aesthetic decisions made in the interface of a digital product. These choices, which can include flat design, material design, minimalism, and various others, have a significant influence on the user experience and the product's brand identity.
Design style in UI/UX refers to the visual presentation and aesthetic decisions made in the interface of a digital product. These choices, which can include flat design, material design, minimalism, and various others, have a significant influence on the user experience and the product's brand identity.
STYLE GUIDE
STYLE GUIDE
Color Pallete
Primary
#102041
#152955
#14366D
#1B62C5
#1E78F0
Accent
#F9C7E5
#B6D3F1
#F39897
#F8CEA6
#B7ADE9
#D1EBAC
#FE6313
#EE456D
#57CDA6
Greyscale
#222222
#585858
#989898
#C4C4C
#F2F2F2
Typography
[Satoshi]

Aa
32 Bold
Aa
24 Bold
Aa
24 Black
Aa
20 Bold
Aa
16 Medium
Aa
14 Regular
brown fox
jumps over
the lazy dog
Color Pallete
Primary
#102041
#152955
#14366D
#1B62C5
#1E78F0
Accent
#F9C7E5
#B6D3F1
#F39897
#F8CEA6
#B7ADE9
#D1EBAC
#FE6313
#EE456D
#57CDA6
Greyscale
#222222
#585858
#989898
#C4C4C
#F2F2F2
Typography
[Satoshi]
Aa
32 Bold
Aa
24 Bold
Aa
24 Black
Aa
20 Bold
Aa
16 Medium
Aa
14 Regular
brown fox
jumps over
the lazy dog
[wireframe.&.information.architecture]
[wireframe.&.information.architecture]
A user flow directs users through a process, encompassing their actions and choices to create an intuitive user experience. A sitemap provides a visual representation of the product's structure, assisting with content organization and navigation. It serves as the basis for creating wireframes and facilitates communication among stakeholders.
A user flow directs users through a process, encompassing their actions and choices to create an intuitive user experience. A sitemap provides a visual representation of the product's structure, assisting with content organization and navigation. It serves as the basis for creating wireframes and facilitates communication among stakeholders.
[wireframe]
[site.map]
[wireframe]
[user.flow]
[wireframe]
[user.flow]
[ui.solutions]
[ui.solutions]
To resolve the problem of limited information visibility on the current website, I have created a new website that prioritizes improved readability. Through strategic categorization and hierarchical organization of content, users can readily access and comprehend the information. Furthermore, each page features clear and fitting calls to action to ensure the best possible user engagement.
To resolve the problem of limited information visibility on the current website, I have created a new website that prioritizes improved readability. Through strategic categorization and hierarchical organization of content, users can readily access and comprehend the information. Furthermore, each page features clear and fitting calls to action to ensure the best possible user engagement.
UI DESIGN
UI DESIGN
[01]
LOGIN PAGE
When visitors access LOKET, they are presented with two options: if they don't already have an account, they can create one by signing up. If they already have an account, they can simply log in.
[02]
CREATE EVENT (BUAT EVENT)
On the “Create Event (Buat Event)” page, users have the option to input fundamental event details, including the event name, organizer information, event format, venue details, event theme, event date and time, ticket information, event promotion, and various other specific event-related information.
[03]
HOME DASHBOARD
On the Home Dashboard, users can access a complete summary of their event management activities. The dashboard provides an overview of key metrics and real-time updates to help users monitor their event performance efficiently.
1
Live Event Banner – A special banner notification that informs users when an event is currently live.
2
Event Status Overview – Easily track all your events, including ongoing events, drafts in the planning stage, and completed events with past data.
3
Total Attendees – See the total number of attendees registered for the event.
4
Total Transactions – Monitor the overall number of ticket transactions.
5
Total Tickets Sold – Check the total number of tickets sold across events.
6
Total Revenue – View the total revenue generated from ticket sales.

[04]
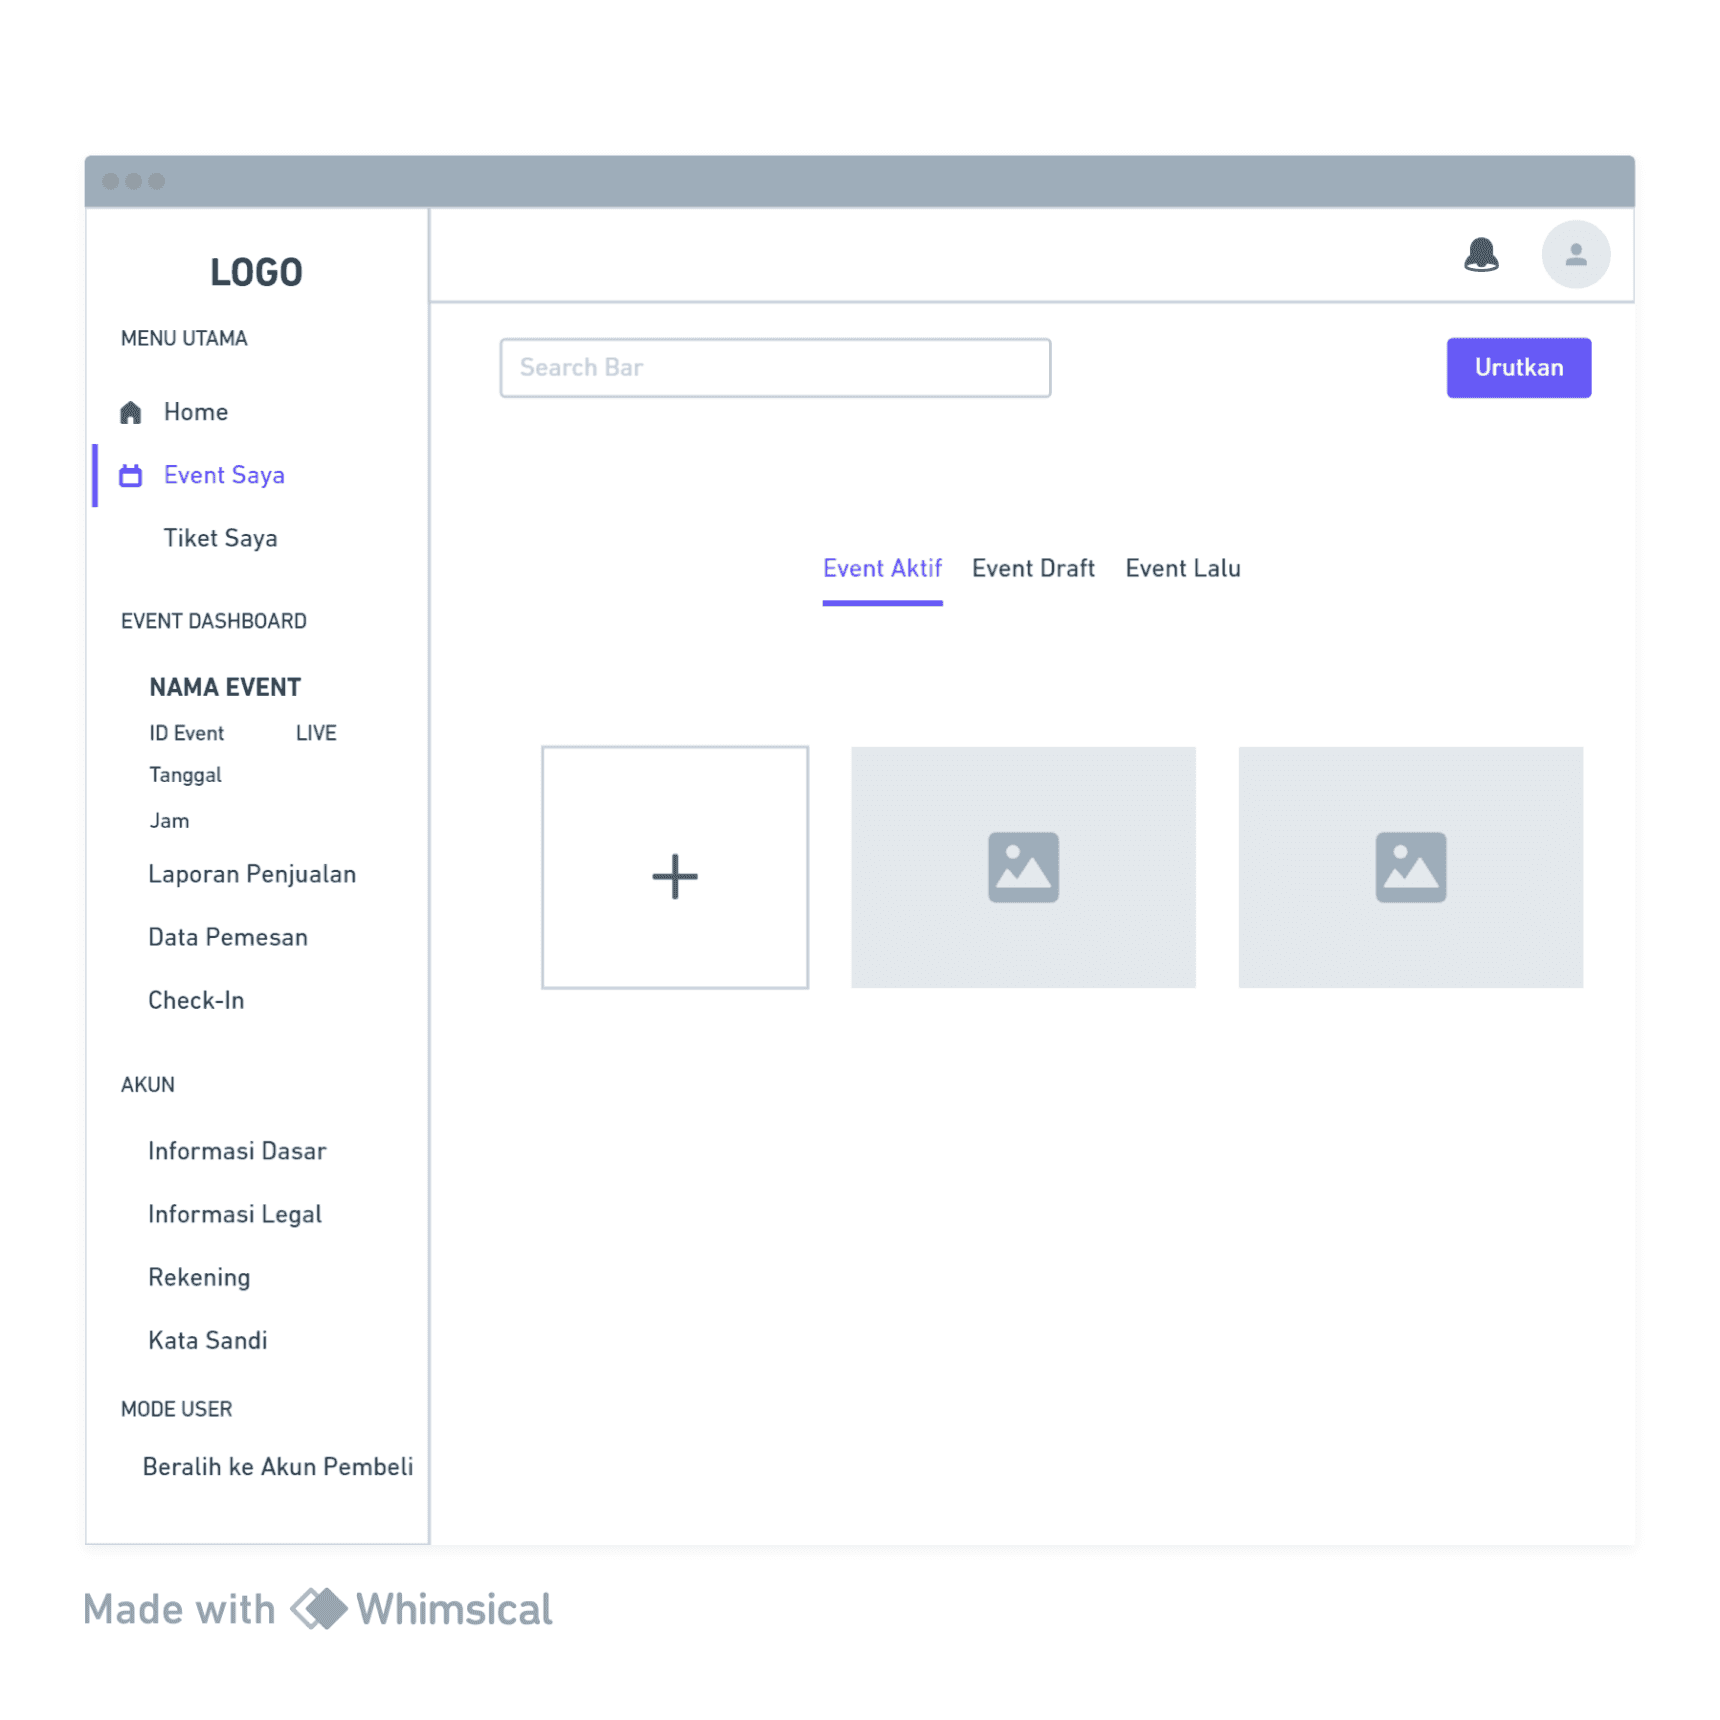
MY EVENT (EVENT SAYA)
After an event has been published, it will automatically appear on the “My Event (Event Saya)” page. Users can find their recently published event in the “Active Events (Event Aktif)” tab and access the event's details.

[05]
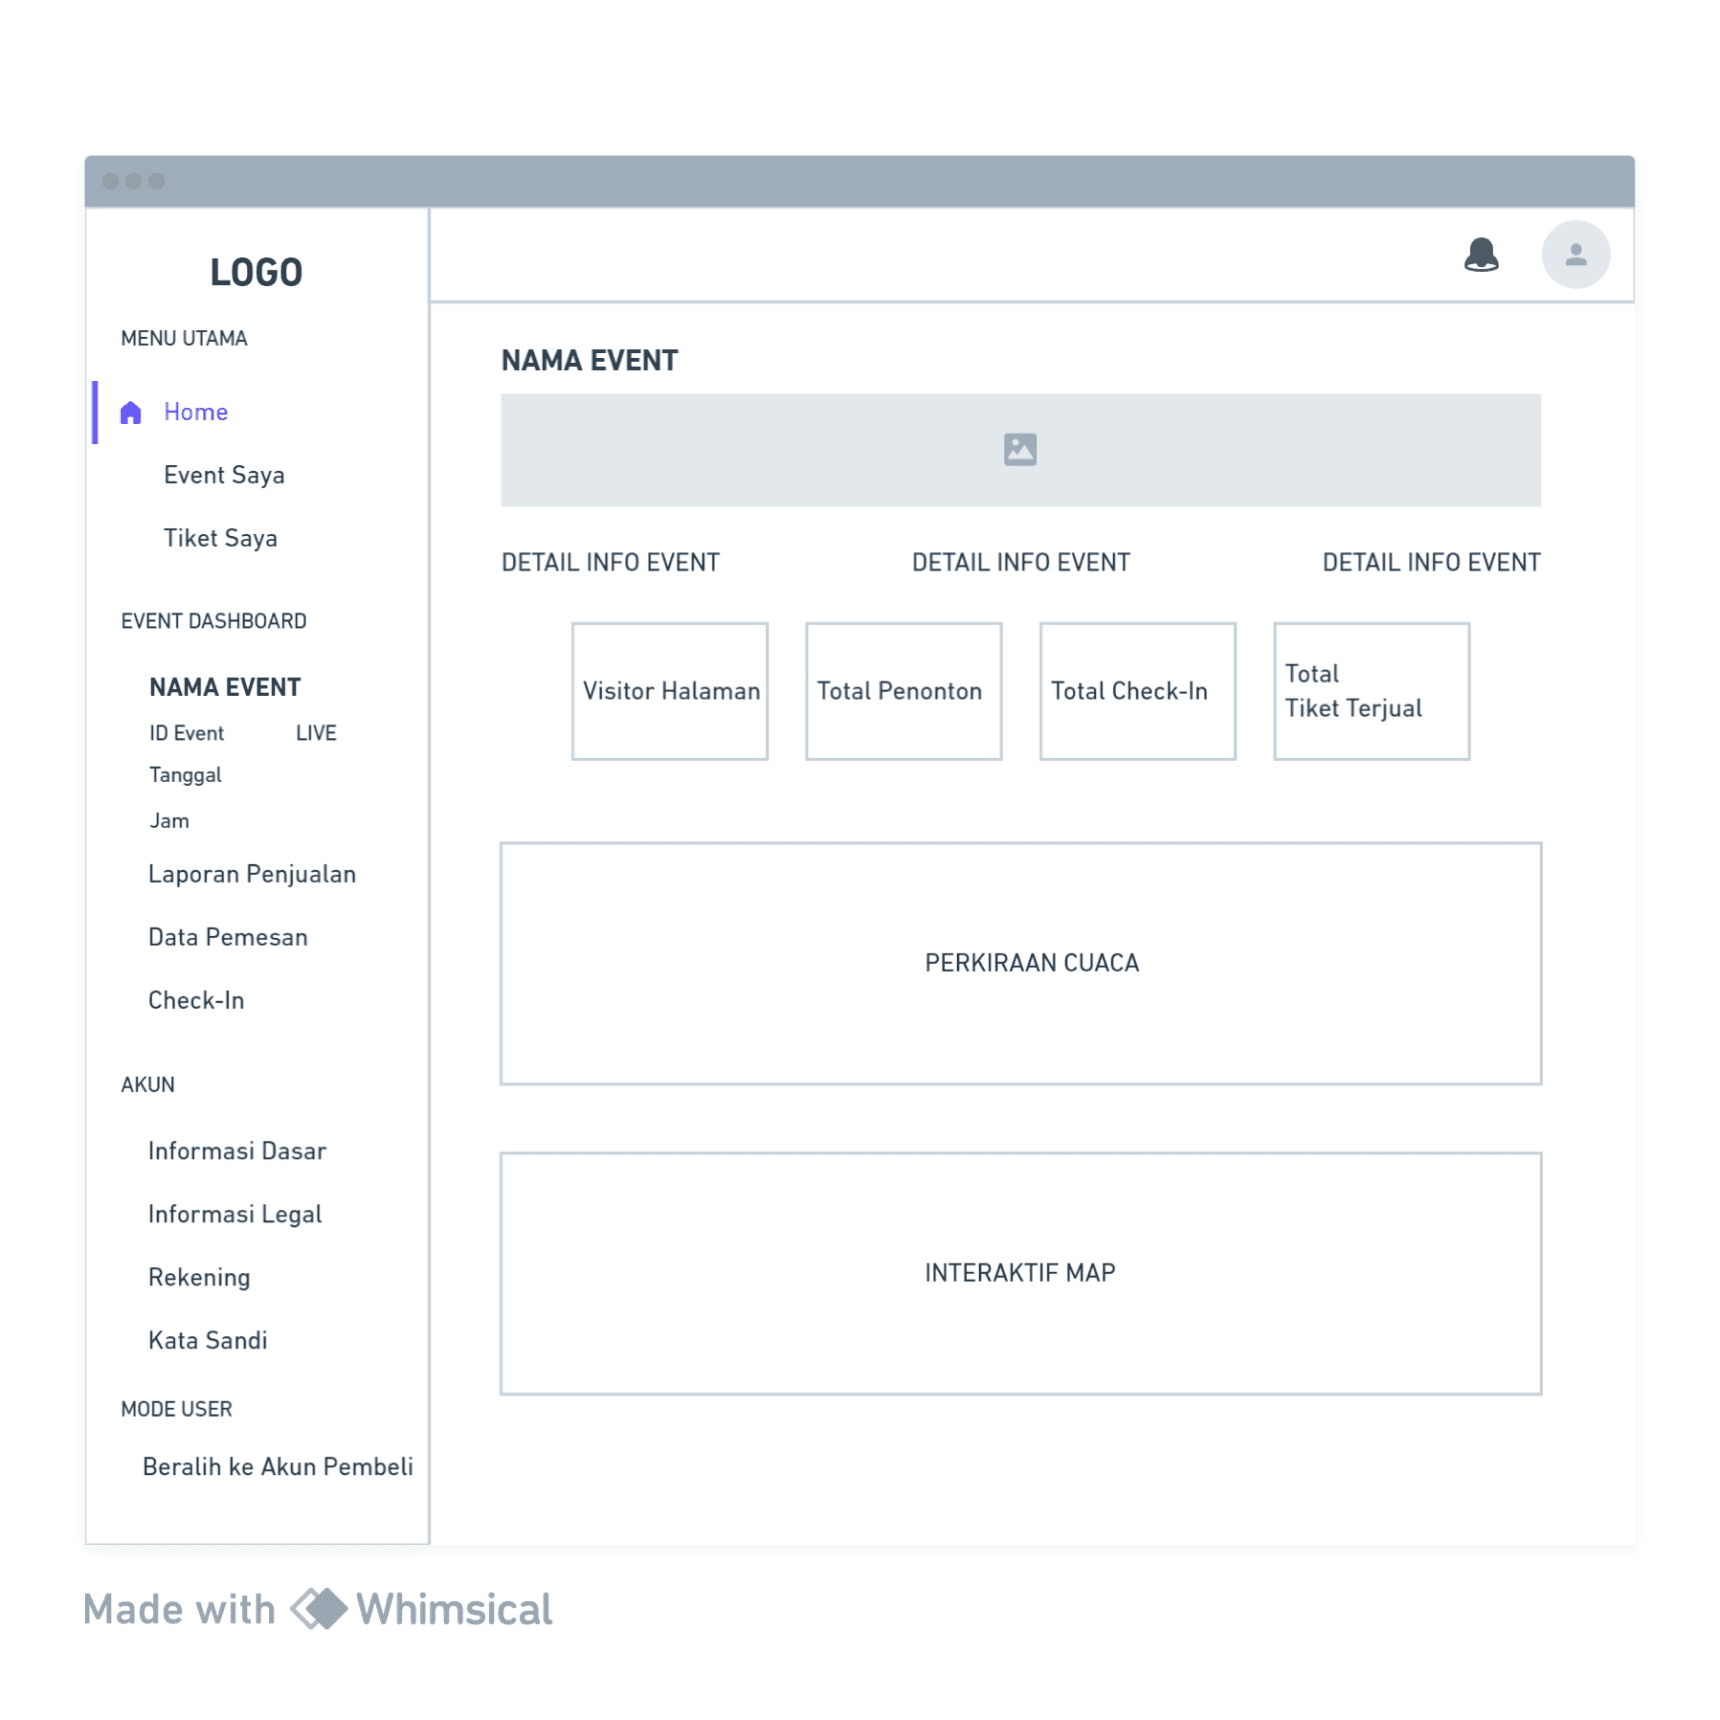
EVENT DASHBOARD
When users log in to the dashboard, they can immediately access essential event statistics, including the event page's visitor count, total attendees, cumulative check-ins, and live updates on ticket sales. Additionally, users have the capability to monitor the most recent ticket transactions, check the availability of tickets in various categories, and access real-time weather forecasts.
1
Event Page Visitor Count – Track how many people have viewed your event page.
2
Total Attendees – See the total number of attendees registered for the event.
3
Cumulative Check-Ins – Monitor the number of attendees who have checked in.
4
Live Ticket Sales Updates – Get real-time updates on ticket purchases.
5
Recent Ticket Transactions – View the latest ticket sales and transaction details.
6
Ticket Availability by Category – Check remaining ticket stock for different ticket types.
7
Real-Time Weather Forecast – Stay updated on the latest weather conditions for your event day.

[06]
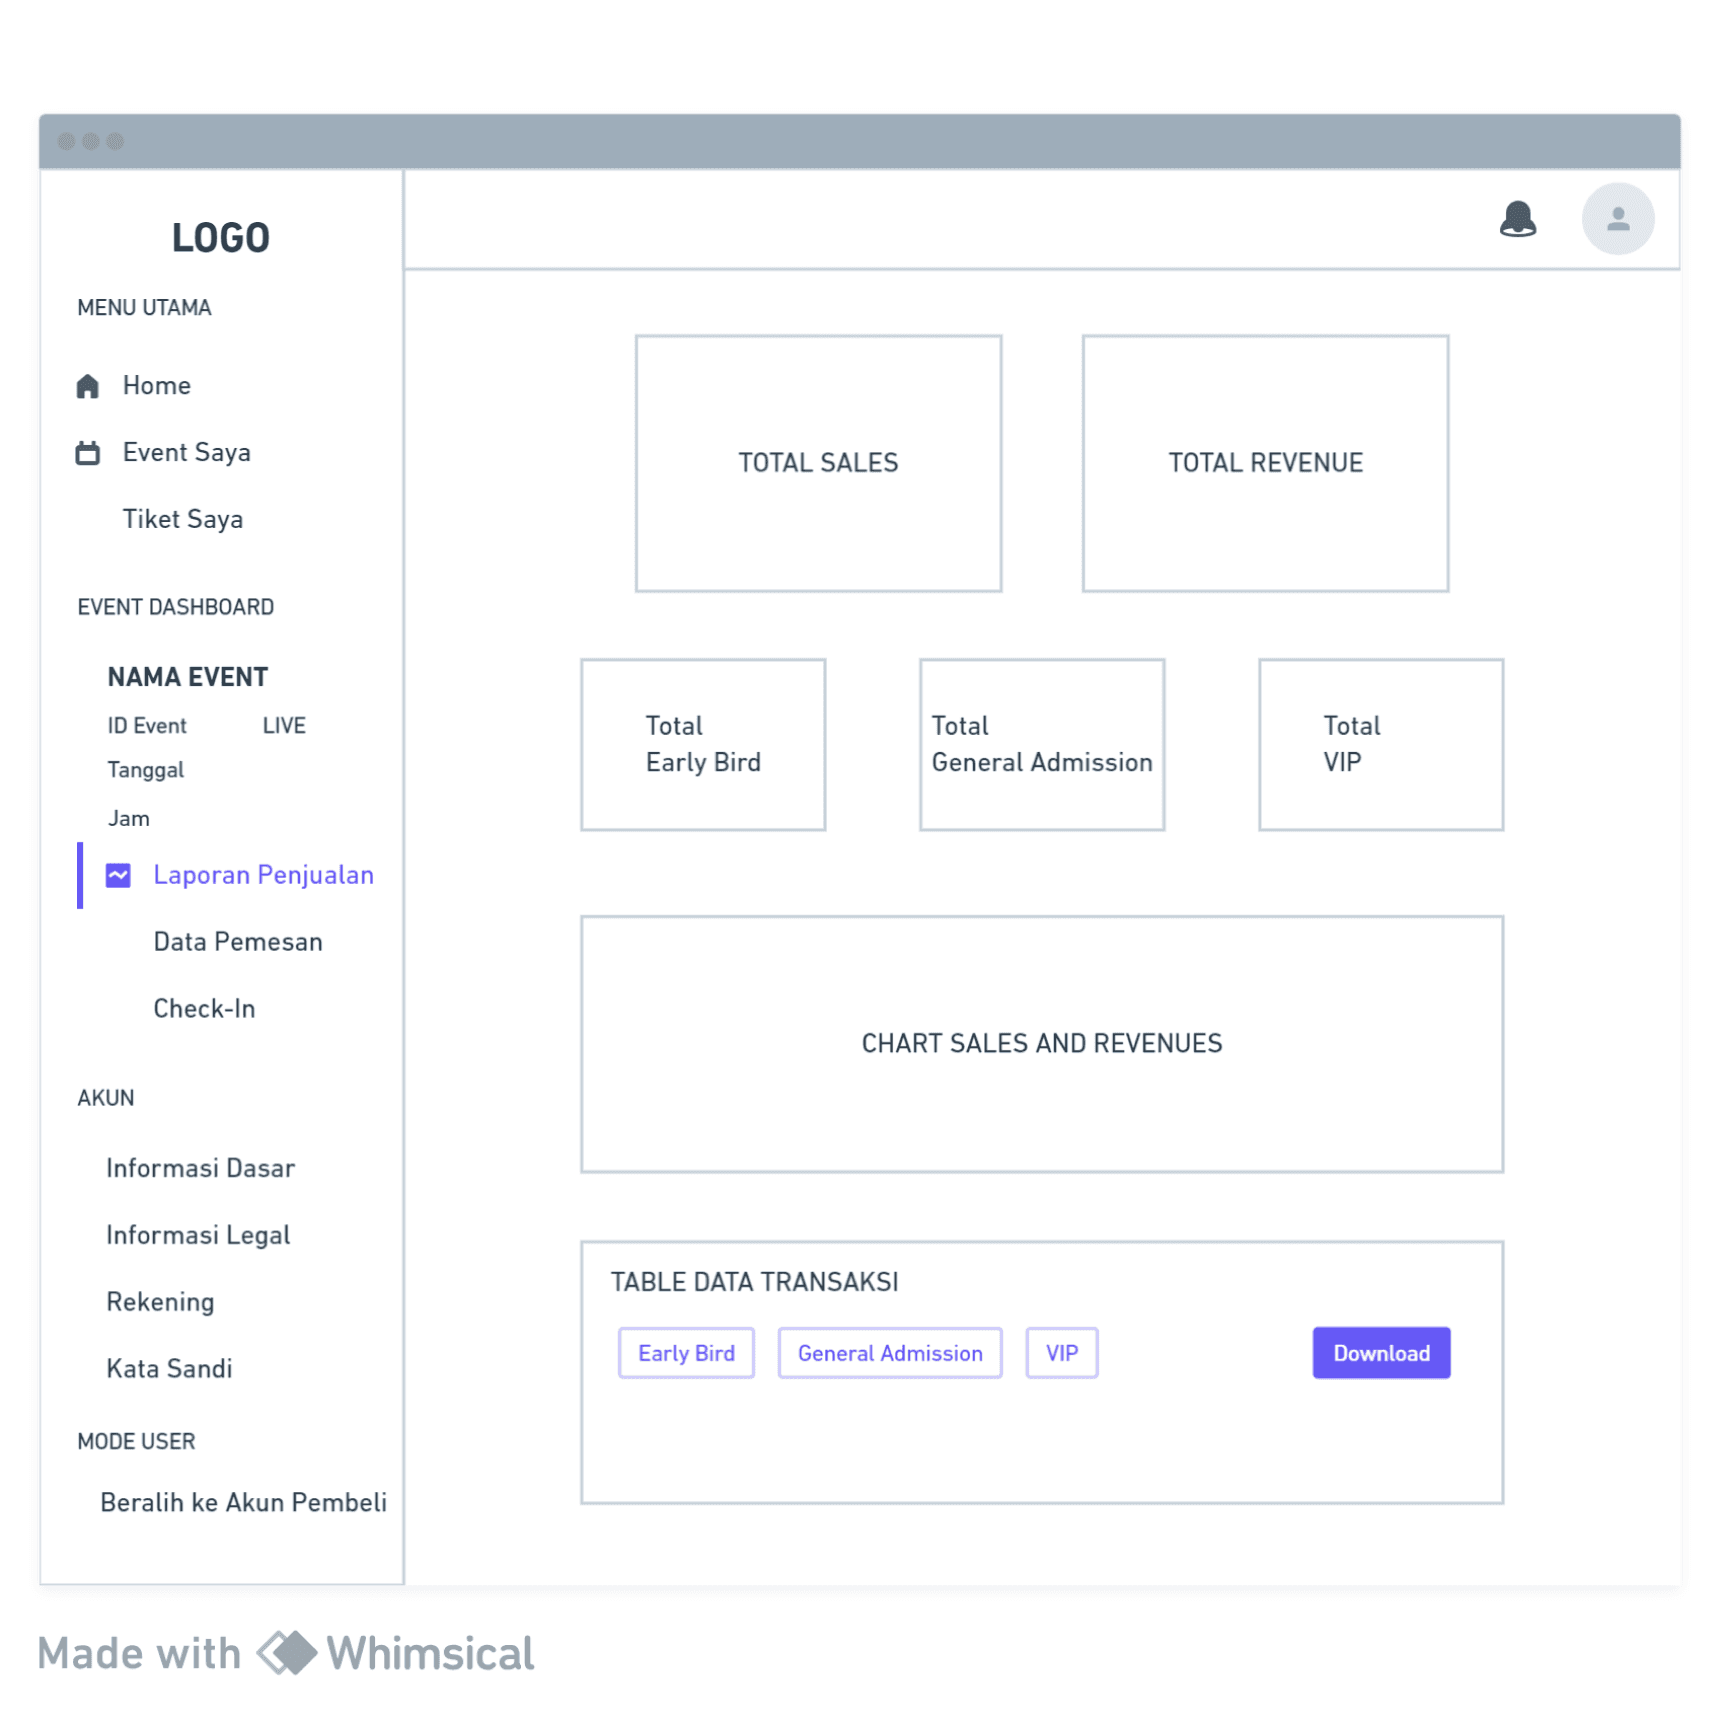
SALES REPORT (LAPORAN PENJUALAN)
On this page, users can access a comprehensive sales report that includes total ticket sales categorized by ticket type. Additionally, users can view detailed transaction records, monitor revenue, and analyze sales trends. The report also provides insights into ticket availability and performance metrics, helping users make data-driven decisions for event management.
1
Total Visitor Page – Track the number of visitors accessing the event page.
2
Total Ticket Sales – View the total number of tickets sold.
3
Total Transactions – Monitor the total number of ticket purchase transactions.
4
Sales & Transaction Chart – Visual representation of sales performance and transaction trends.
5
Transaction Records – Access a database of all ticket sales and transaction details.

[07]
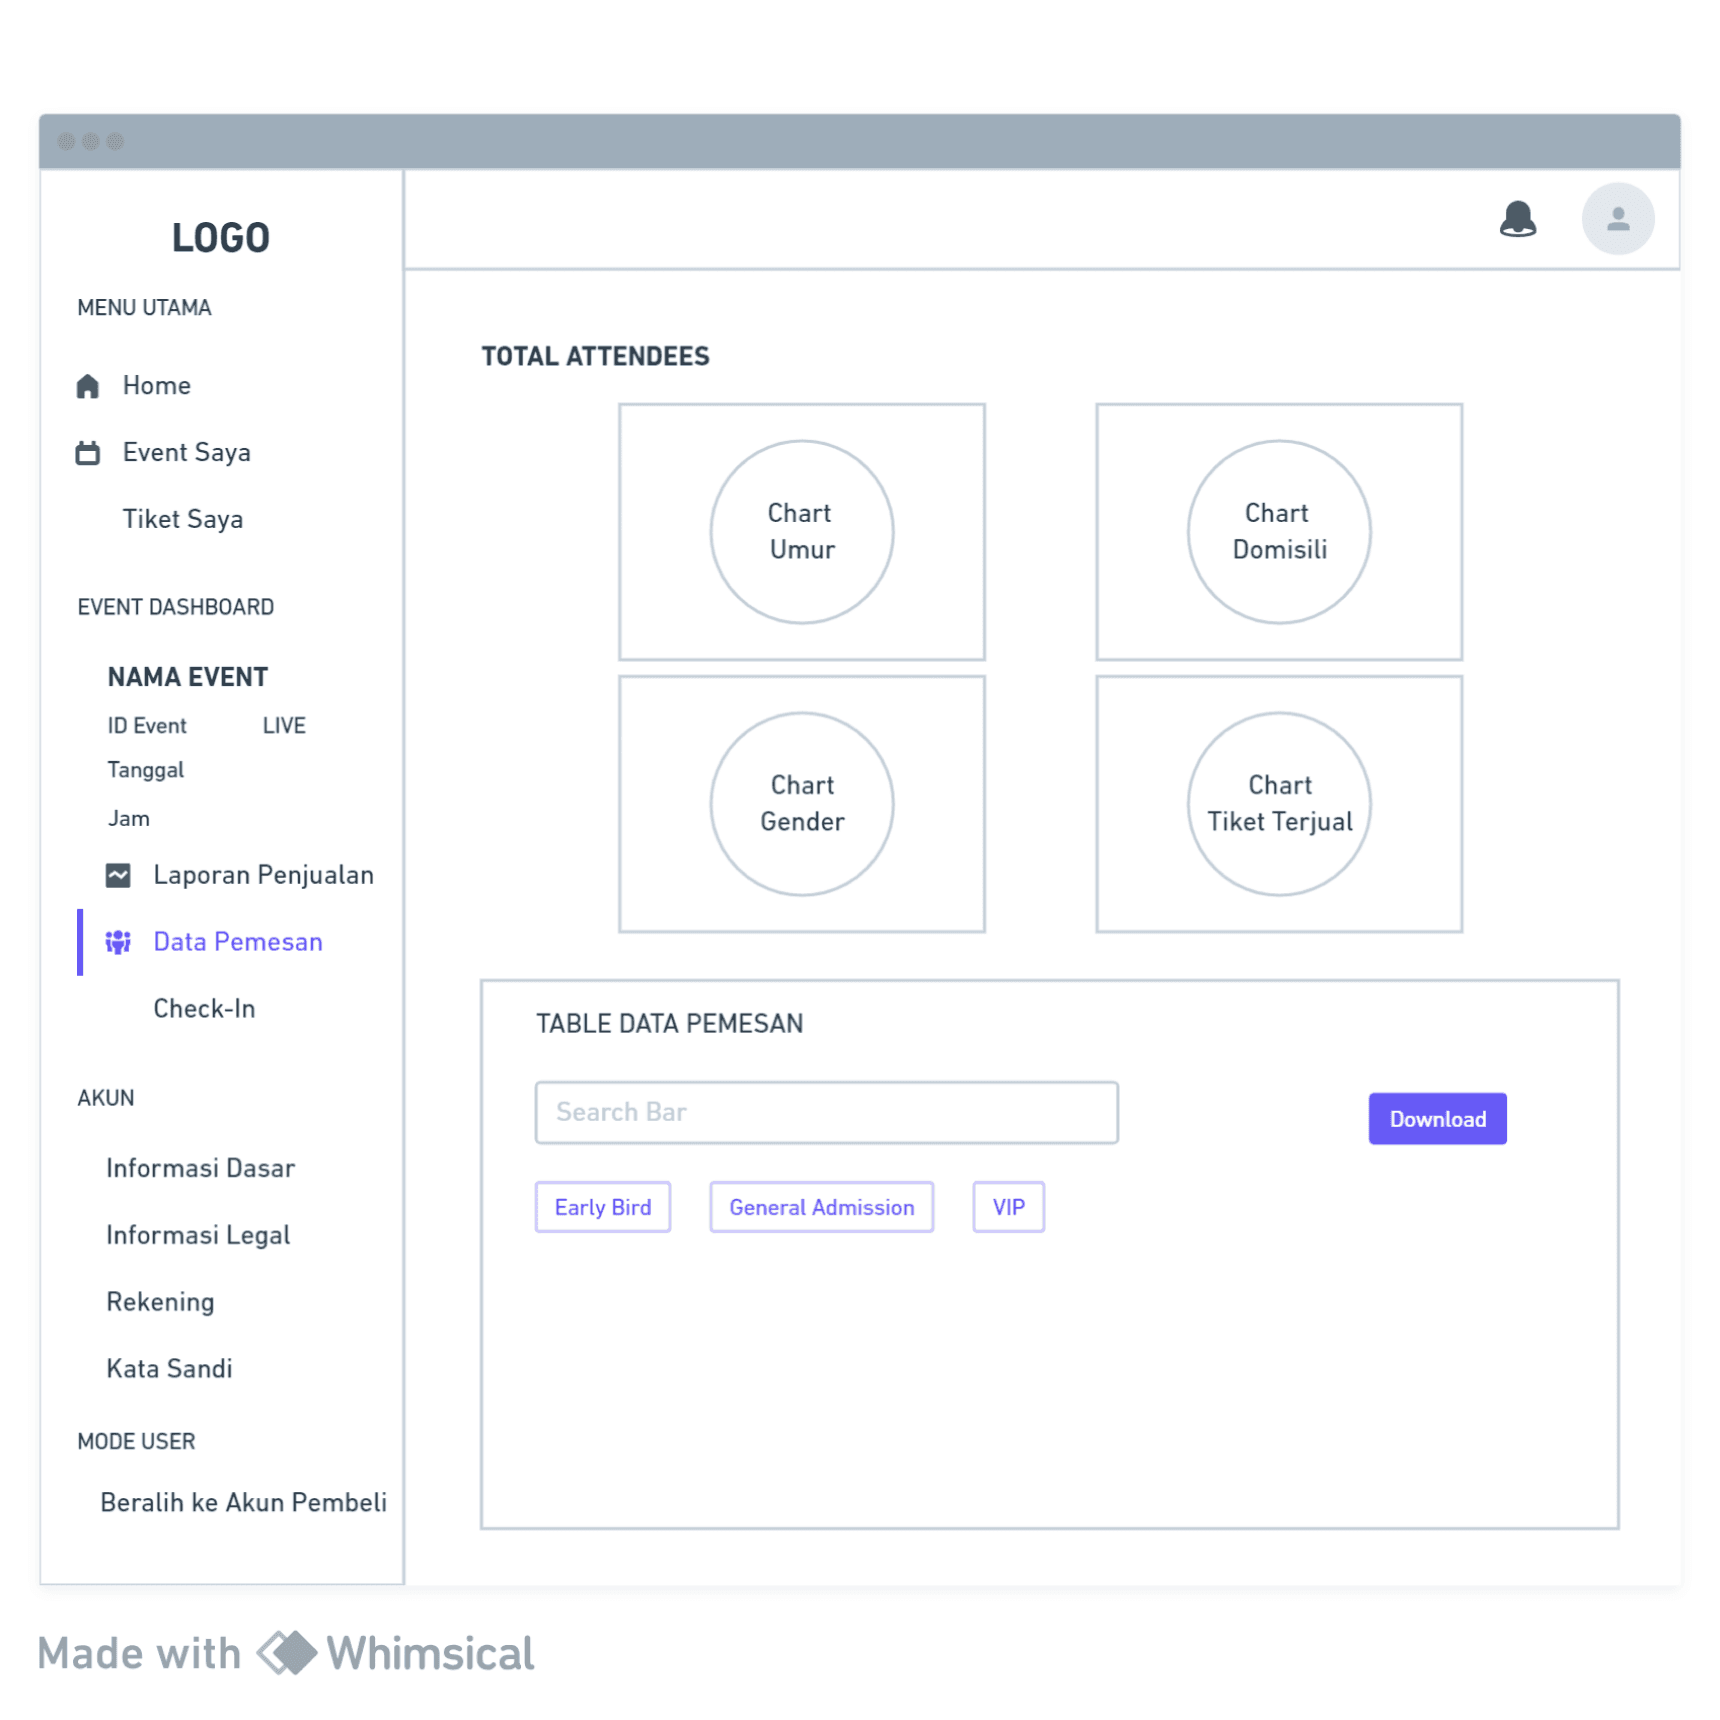
CUSTOMER DATA (DATA PEMESAN)
Upon acquiring customers through event ticket sales, users can access demographic details of concert ticket purchasers on the "Data Pemesan" page. This page provides insights into buyer information, helping users analyze audience demographics.
1
Demographic Data – View key details about ticket buyers, including:
Gender – Identify the proportion of male and female buyers.
Age – Analyze the age distribution of ticket purchasers.
Location – Track buyers’ domiciles to understand geographic reach.
2
List of Purchasers – Access a complete list of ticket buyers along with their purchase details.

[09]
USER ROLES & PERMISSIONS MANAGEMENT
On this page, event managers can efficiently manage user access by handling roles and permissions.
1
Add New Users – Invite and register new team members.
2
Assign Roles – Designate roles such as Admin, Event Manager, or Staff.
3
Modify Permissions – Control access levels for different dashboard features.
4
Revoke Access – Remove users or adjust their permissions when needed.


[01]
LOGIN PAGE
When visitors access LOKET, they are presented with two options: if they don't already have an account, they can create one by signing up. If they already have an account, they can simply log in.
[02]
CREATE EVENT (BUAT EVENT)
On the “Create Event (Buat Event)” page, users have the option to input fundamental event details, including the event name, organizer information, event format, venue details, event theme, event date and time, ticket information, event promotion, and various other specific event-related information.
[03]
HOME DASHBOARD
On the Home Dashboard, users can access a complete summary of their event management activities. The dashboard provides an overview of key metrics and real-time updates to help users monitor their event performance efficiently.
1
Live Event Banner – A special banner notification that informs users when an event is currently live.
2
Event Status Overview – Easily track all your events, including ongoing events, drafts in the planning stage, and completed events with past data.
3
Total Attendees – See the total number of attendees registered for the event.
4
Total Transactions – Monitor the overall number of ticket transactions.
5
Total Tickets Sold – Check the total number of tickets sold across events.
6
Total Revenue – View the total revenue generated from ticket sales.
[04]
MY EVENT (EVENT SAYA)
After an event has been published, it will automatically appear on the “My Event (Event Saya)” page. Users can find their recently published event in the “Active Events (Event Aktif)” tab and access the event's details.
[05]
EVENT DASHBOARD
When users log in to the dashboard, they can immediately access essential event statistics, including the event page's visitor count, total attendees, cumulative check-ins, and live updates on ticket sales. Additionally, users have the capability to monitor the most recent ticket transactions, check the availability of tickets in various categories, and access real-time weather forecasts.
1
Event Page Visitor Count – Track how many people have viewed your event page.
2
Total Attendees – See the total number of attendees registered for the event.
3
Cumulative Check-Ins – Monitor the number of attendees who have checked in.
4
Live Ticket Sales Updates – Get real-time updates on ticket purchases.
5
Recent Ticket Transactions – View the latest ticket sales and transaction details.
6
Ticket Availability by Category – Check remaining ticket stock for different ticket types.
7
Real-Time Weather Forecast – Stay updated on the latest weather conditions for your event day.
[06]
SALES REPORT (LAPORAN PENJUALAN)
On this page, users can access a comprehensive sales report that includes total ticket sales categorized by ticket type. Additionally, users can view detailed transaction records, monitor revenue, and analyze sales trends. The report also provides insights into ticket availability and performance metrics, helping users make data-driven decisions for event management.
1
Total Visitor Page – Track the number of visitors accessing the event page.
2
Total Ticket Sales – View the total number of tickets sold.
3
Total Transactions – Monitor the total number of ticket purchase transactions.
4
Sales & Transaction Chart – Visual representation of sales performance and transaction trends.
5
Transaction Records – Access a database of all ticket sales and transaction details.
[07]
CUSTOMER DATA (DATA PEMESAN)
Upon acquiring customers through event ticket sales, users can access demographic details of concert ticket purchasers on the "Data Pemesan" page. This page provides insights into buyer information, helping users analyze audience demographics.
1
Demographic Data – View key details about ticket buyers, including:
Gender – Identify the proportion of male and female buyers.
Age – Analyze the age distribution of ticket purchasers.
Location – Track buyers’ domiciles to understand geographic reach.
2
List of Purchasers – Access a complete list of ticket buyers along with their purchase details.
[09]
USER ROLES & PERMISSIONS MANAGEMENT
On this page, event managers can efficiently manage user access by handling roles and permissions.
1
Add New Users – Invite and register new team members.
2
Assign Roles – Designate roles such as Admin, Event Manager, or Staff.
3
Modify Permissions – Control access levels for different dashboard features.
4
Revoke Access – Remove users or adjust their permissions when needed.
[01]
LOGIN PAGE
When visitors access LOKET, they are presented with two options: if they don't already have an account, they can create one by signing up. If they already have an account, they can simply log in.


[02]
CREATE EVENT (BUAT EVENT)
On the “Create Event (Buat Event)” page, users have the option to input fundamental event details, including the event name, organizer information, event format, venue details, event theme, event date and time, ticket information, event promotion, and various other specific event-related information.


[03]
HOME DASHBOARD
On the Home Dashboard, users can access a complete summary of their event management activities. The dashboard provides an overview of key metrics and real-time updates to help users monitor their event performance efficiently.
1
Live Event Banner – A special banner notification that informs users when an event is currently live.
2
Event Status Overview – Easily track all your events, including ongoing events, drafts in the planning stage, and completed events with past data.
3
Total Attendees – See the total number of attendees registered for the event.
4
Total Transactions – Monitor the overall number of ticket transactions.
5
Total Tickets Sold – Check the total number of tickets sold across events.
6
Total Revenue – View the total revenue generated from ticket sales.
[04]
MY EVENT (EVENT SAYA)
After an event has been published, it will automatically appear on the “My Event (Event Saya)” page. Users can find their recently published event in the “Active Events (Event Aktif)” tab and access the event's details.
[05]
EVENT DASHBOARD
Upon logging into the dashboard, users are instantly presented with key event data such as visitor numbers, total attendees, check-in counts, and real-time ticket sales. They can also track recent ticket transactions, view ticket availability by category, and see live weather updates.
1
Event Page Visitor Count – Track how many people have viewed your event page.
2
Total Attendees – See the total number of attendees registered for the event.
3
Cumulative Check-Ins – Monitor the number of attendees who have checked in.
4
Live Ticket Sales Updates – Get real-time updates on ticket purchases.
5
Recent Ticket Transactions – View the latest ticket sales and transaction details.
6
Ticket Availability by Category – Check remaining ticket stock for different ticket types.
7
Real-Time Weather Forecast – Stay updated on the latest weather conditions for your event day.
[06]
SALES REPORT (LAPORAN PENJUALAN)
Users can access in-depth sales insights, including ticket type breakdowns, transaction logs, revenue tracking, trend analysis, and ticket availability to help guide event planning and decision-making.
1
Total Visitor Page – Track the number of visitors accessing the event page.
2
Total Ticket Sales – View the total number of tickets sold.
3
Total Transactions – Monitor the total number of ticket purchase transactions.
4
Sales & Transaction Chart – Visual representation of sales performance and transaction trends.
5
Transaction Records – Access a database of all ticket sales and transaction details.
[07]
CUSTOMER DATA (DATA PEMESAN)
Users can access the "Data Pemesan" page to view buyer demographics and gain insights that support audience analysis after ticket sales.
1
Demographic Data – View key details about ticket buyers, including:
Gender – Identify the proportion of male and female buyers.
Age – Analyze the age distribution of ticket purchasers.
Location – Track buyers’ domiciles to understand geographic reach.
2
List of Purchasers – Access a complete list of ticket buyers along with their purchase details.
[08]
CHECK-IN MANAGEMENT
Users can track check-ins by entrance and ticket type, helping manage crowd flow and ensure smooth event access in real time.
1
Check-In Status
Checked-In – List of attendees who have successfully checked in.
Not Checked-In – List of ticket holders who have not yet checked in.
2
Check-In Status
Checked-In – List of attendees who have successfully checked in.
Not Checked-In – List of ticket holders who have not yet checked in.
3
Seat Map – Visual representation of seating arrangements and occupied seats.
4
Check-In List – A complete record of attendee check-ins, including: Name, ID, Ticket Number, Check-In Date, Check-In Time, Ticket Type, and Check-In Gate

[09]
USER ROLES & PERMISSIONS MANAGEMENT
On this page, event managers can efficiently manage user access by handling roles and permissions.
1
Add New Users – Invite and register new team members.
2
Assign Roles – Designate roles such as Admin, Event Manager, or Staff.
3
Modify Permissions – Control access levels for different dashboard features.
4
Revoke Access – Remove users or adjust their permissions when needed.
[01]
LOGIN PAGE
When visitors access LOKET, they are presented with two options: if they don't already have an account, they can create one by signing up. If they already have an account, they can simply log in.
[02]
CREATE EVENT (BUAT EVENT)
On the “Create Event (Buat Event)” page, users have the option to input fundamental event details, including the event name, organizer information, event format, venue details, event theme, event date and time, ticket information, event promotion, and various other specific event-related information.
[03]
HOME DASHBOARD
On the Home Dashboard, users can access a complete summary of their event management activities. The dashboard provides an overview of key metrics and real-time updates to help users monitor their event performance efficiently.
1
Live Event Banner – A special banner notification that informs users when an event is currently live.
2
Event Status Overview – Easily track all your events, including ongoing events, drafts in the planning stage, and completed events with past data.
3
Total Attendees – See the total number of attendees registered for the event.
4
Total Transactions – Monitor the overall number of ticket transactions.
5
Total Tickets Sold – Check the total number of tickets sold across events.
6
Total Revenue – View the total revenue generated from ticket sales.
[04]
MY EVENT (EVENT SAYA)
After an event has been published, it will automatically appear on the “My Event (Event Saya)” page. Users can find their recently published event in the “Active Events (Event Aktif)” tab and access the event's details.
[05]
EVENT DASHBOARD
Upon logging into the dashboard, users are instantly presented with key event data such as visitor numbers, total attendees, check-in counts, and real-time ticket sales. They can also track recent ticket transactions, view ticket availability by category, and see live weather updates.
1
Event Page Visitor Count – Track how many people have viewed your event page.
2
Total Attendees – See the total number of attendees registered for the event.
3
Cumulative Check-Ins – Monitor the number of attendees who have checked in.
4
Live Ticket Sales Updates – Get real-time updates on ticket purchases.
5
Recent Ticket Transactions – View the latest ticket sales and transaction details.
6
Ticket Availability by Category – Check remaining ticket stock for different ticket types.
7
Real-Time Weather Forecast – Stay updated on the latest weather conditions for your event day.
[06]
SALES REPORT (LAPORAN PENJUALAN)
Users can access in-depth sales insights, including ticket type breakdowns, transaction logs, revenue tracking, trend analysis, and ticket availability to help guide event planning and decision-making.
1
Total Visitor Page – Track the number of visitors accessing the event page.
2
Total Ticket Sales – View the total number of tickets sold.
3
Total Transactions – Monitor the total number of ticket purchase transactions.
4
Sales & Transaction Chart – Visual representation of sales performance and transaction trends.
5
Transaction Records – Access a database of all ticket sales and transaction details.
[07]
CUSTOMER DATA (DATA PEMESAN)
Users can access the "Data Pemesan" page to view buyer demographics and gain insights that support audience analysis after ticket sales.
1
Demographic Data – View key details about ticket buyers, including:
Gender – Identify the proportion of male and female buyers.
Age – Analyze the age distribution of ticket purchasers.
Location – Track buyers’ domiciles to understand geographic reach.
2
List of Purchasers – Access a complete list of ticket buyers along with their purchase details.
[08]
CHECK-IN MANAGEMENT
Users can track check-ins by entrance and ticket type, helping manage crowd flow and ensure smooth event access in real time.
1
Check-In Status
Checked-In – List of attendees who have successfully checked in.
Not Checked-In – List of ticket holders who have not yet checked in.
2
Check-In Status
Checked-In – List of attendees who have successfully checked in.
Not Checked-In – List of ticket holders who have not yet checked in.
3
Seat Map – Visual representation of seating arrangements and occupied seats.
4
Check-In List – A complete record of attendee check-ins, including: Name, ID, Ticket Number, Check-In Date, Check-In Time, Ticket Type, and Check-In Gate
[09]
USER ROLES & PERMISSIONS MANAGEMENT
On this page, event managers can efficiently manage user access by handling roles and permissions.
1
Add New Users – Invite and register new team members.
2
Assign Roles – Designate roles such as Admin, Event Manager, or Staff.
3
Modify Permissions – Control access levels for different dashboard features.
4
Revoke Access – Remove users or adjust their permissions when needed.


04.
04.
Conduct Usability Testing
Conduct Usability Testing
[type]
Unmoderated
[duration]
10-15 minutes
[participant]
5 Users
[tools]
[type]
Unmoderated
[duration]
10-15 minutes
[participant]
5 Users
[tools]
[testing.remotely]
[testing.remotely]
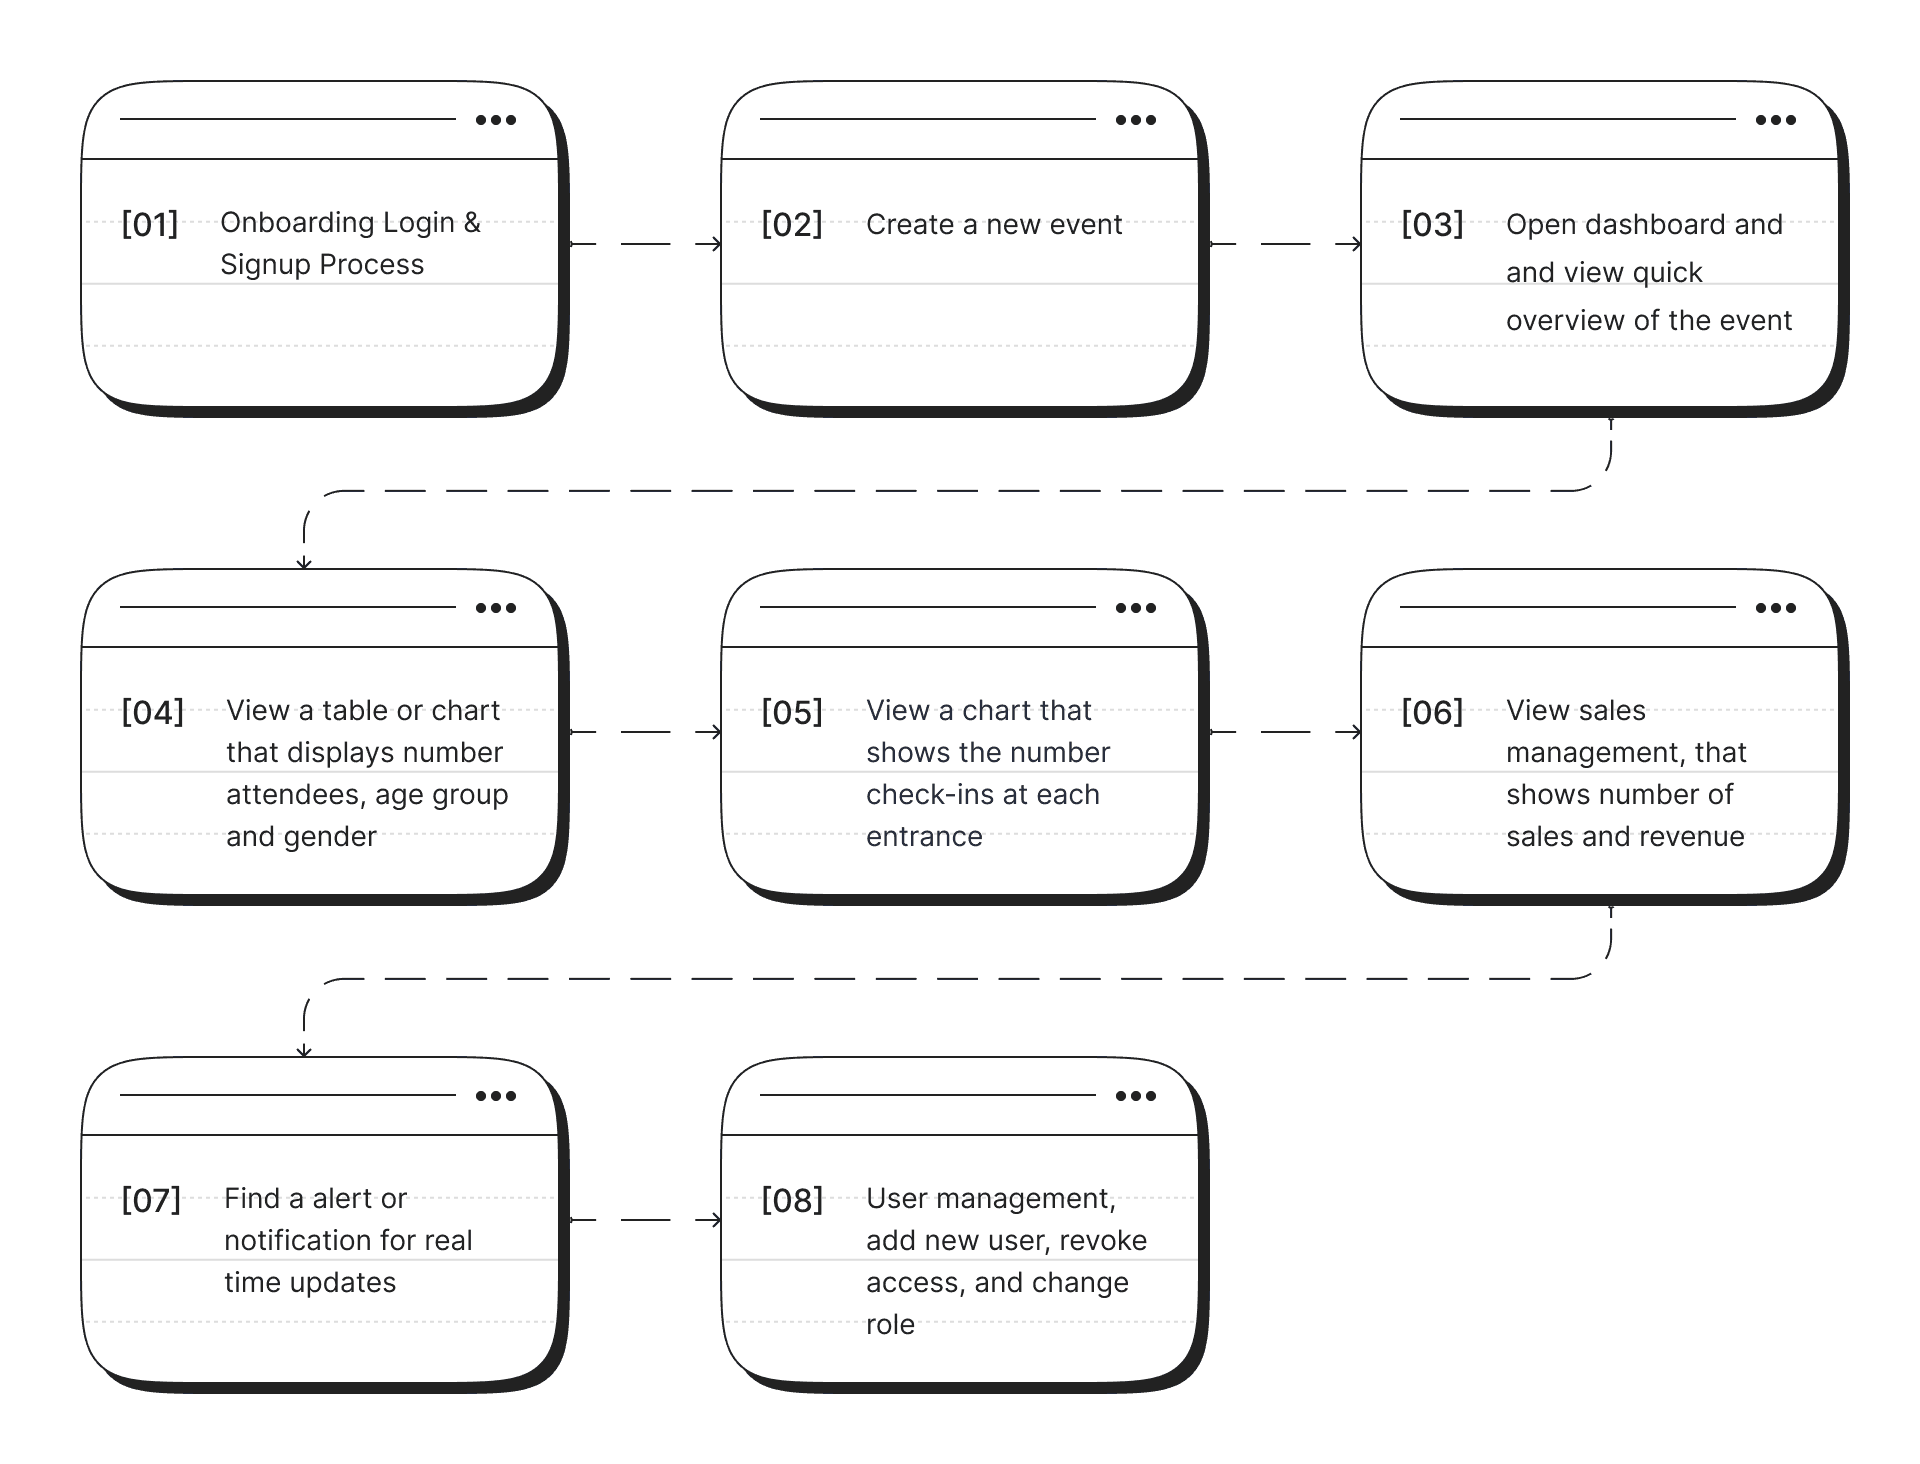
Eight tasks have been created to assess whether users can effectively complete them, and the results will help determine the user-friendliness of the application.
Eight tasks have been created to assess whether users can effectively complete them, and the results will help determine the user-friendliness of the application.
[task]
[result]
[task]
[result]
[task]
[result]
[summary.&.conclusion]
[summary.&.conclusion]
Based on the results of the usability testing I conducted, I have successfully achieved an average success rate of 85%. These results indicate that the design I have created effectively addresses user issues. Out of the 8 tasks that were tested, four of them, namely the first, second, third, and fourth tasks, were completed perfectly by the users.
However, in the fifth, sixth, and seventh tasks, which involved finding real-time alerts or notifications, some users encountered difficulties in completing these tasks. I have identified areas that require improvement in my design to enhance the user experience when dealing with these specific tasks.
In conclusion, the results of the usability testing confirm that my design has been successful in most cases, but there is room for improvement to help users overcome challenges they may face in certain tasks. I am committed to continuously improving my design to provide the best possible user experience.
THANK YOU!
and hope to hear from you soon.
THANK YOU!
and hope to hear from you soon.